A year after Airbnb put $200 million behind its Experiences relaunch, the company still hasn't shared attach rates, a gap we've been noting since the first results came in. A new report from Localbird fills in part of the picture with actual booking data, covering thousands of experience bookings arranged through its concierge service across the U.S., Mexico, and Costa Rica from July 2025 to June 2026.
The numbers answer three questions hosts rarely get data on: who buys experiences, what they buy, and when they decide.
Spend Rises With the Nightly Rate
At properties under $100 a night, 35% of guests respond when offered experiences, but just 4% of those actually book one. At $500+ a night properties, 44% respond and 18% book. The money follows the same curve. Average order value climbs from $128 at the lower tier to $425 at the top, and total spend per guest runs from $166 to $1,000.
Group size matters too. Families traveling with kids drive 30.7% of engagement, followed by groups of five or more adults at 23.7%. Solo travelers sit at just 9.0%.
Transportation and Activities are Best Performing
Transportation and logistics is the most-booked category at 39.1% of all bookings, more than seven times the share of private chefs (5.5%). But it generates just 18.2% of revenue.
Adventure and land tours rank second in volume at 16.3% and first in revenue at 23.3%, with water activities close behind at 20.8% of revenue on 13.0% of bookings.
It also turns out that the highest ticket purchases are for experiences inside the property: private chefs average $464 per order, against $288 for experiences outside the home.
Booked Before Check-In
74% of experiences are requested before guests arrive.
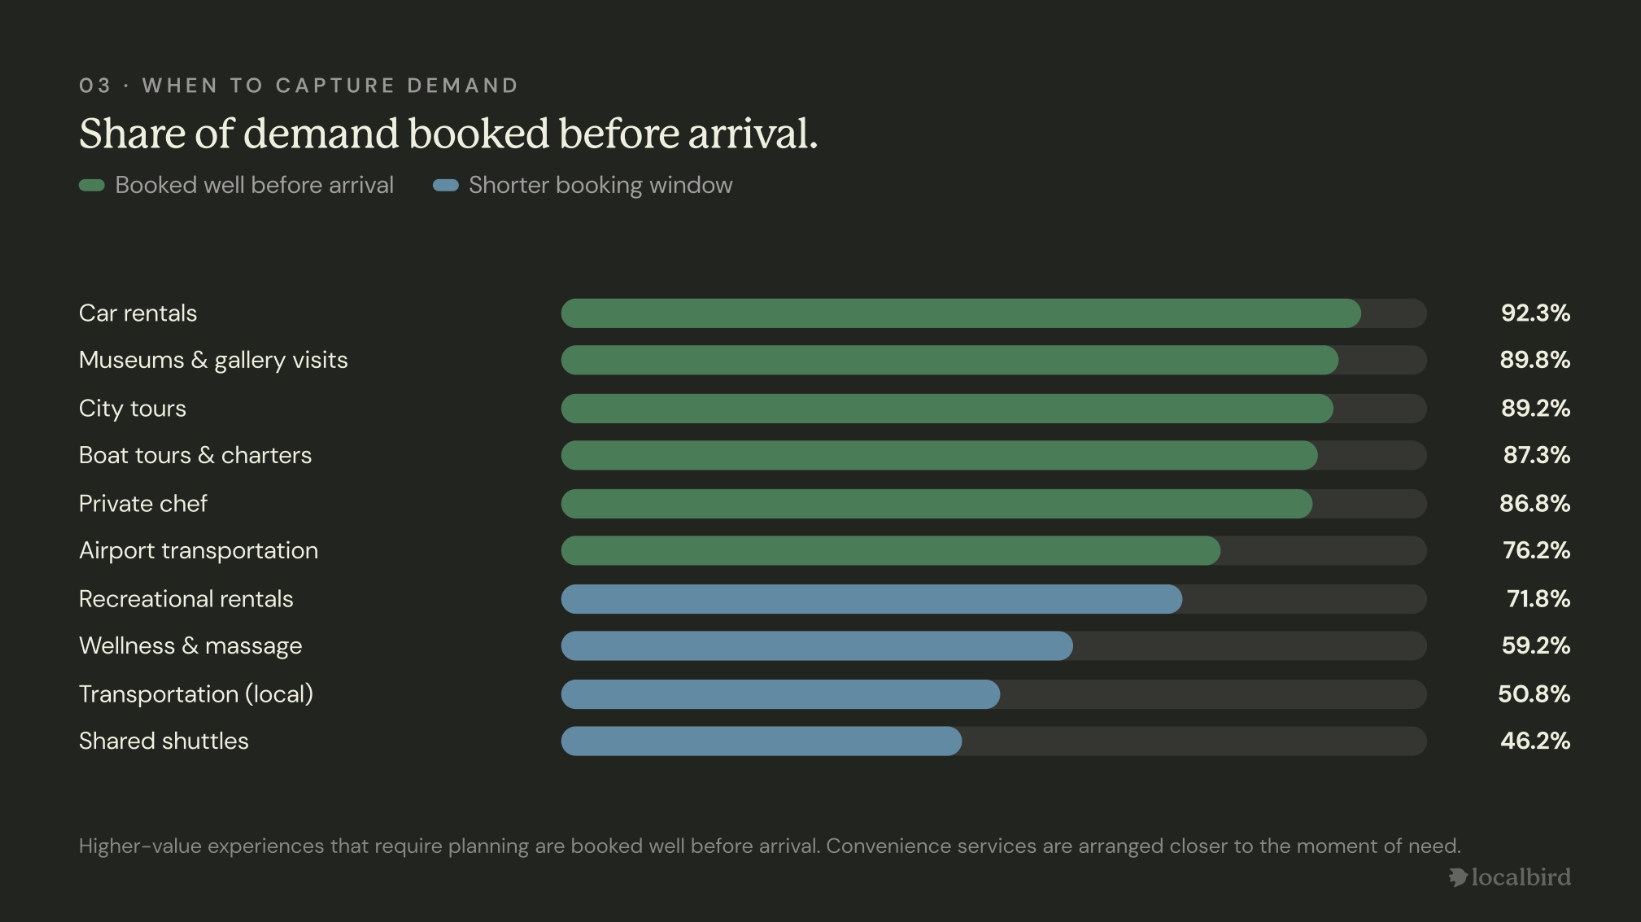
Planning-heavy categories lead the chart. Car rentals (92.3%), city tours (89.2%), and private chefs (86.8%) are locked in well ahead of the stay, while wellness and massage (59.2%) and local transportation (50.8%) get arranged closer to the moment.
What the Numbers Add Up To
Travelers keep telling surveys they want experiences. This data goes a step further than a survey. It shows what travelers are actually spending money on: demand concentrates at higher nightly rates and bigger groups, activities and transportation are the best performing, and nearly 3 out of 4 guests are booking experiences before they check in.

.webp)
.jpg)