Every forecast this year says the same thing. Guests are booking later, the window is collapsing, and you need to reprice for a world of last-minute travel.
We went looking for that in our own reservation data. What we found is that the trend everyone is describing is real, but it is not happening to everyone. It is happening to one kind of market, and the national average buries that completely.
What we measured
We took every US listing in our data that booked consistently between 2022 and 2026 and followed the same properties across all five years. Same listings, every year, so the number cannot be moved by which properties joined or left the dataset.
For each listing we took the median gap between the booking date and the check-in date, restricted to January through July so seasonality is comparable year to year. Then we grouped the listings by what kind of destination they sit in, using a market classifier we already maintain for other work: big city, beach, cabin and mountain, ski, lake, desert, theme park.
The cohort is 1,056 listings. Modest, but each one is its own control across five years, which matters more here than raw volume.
The trend splits three ways
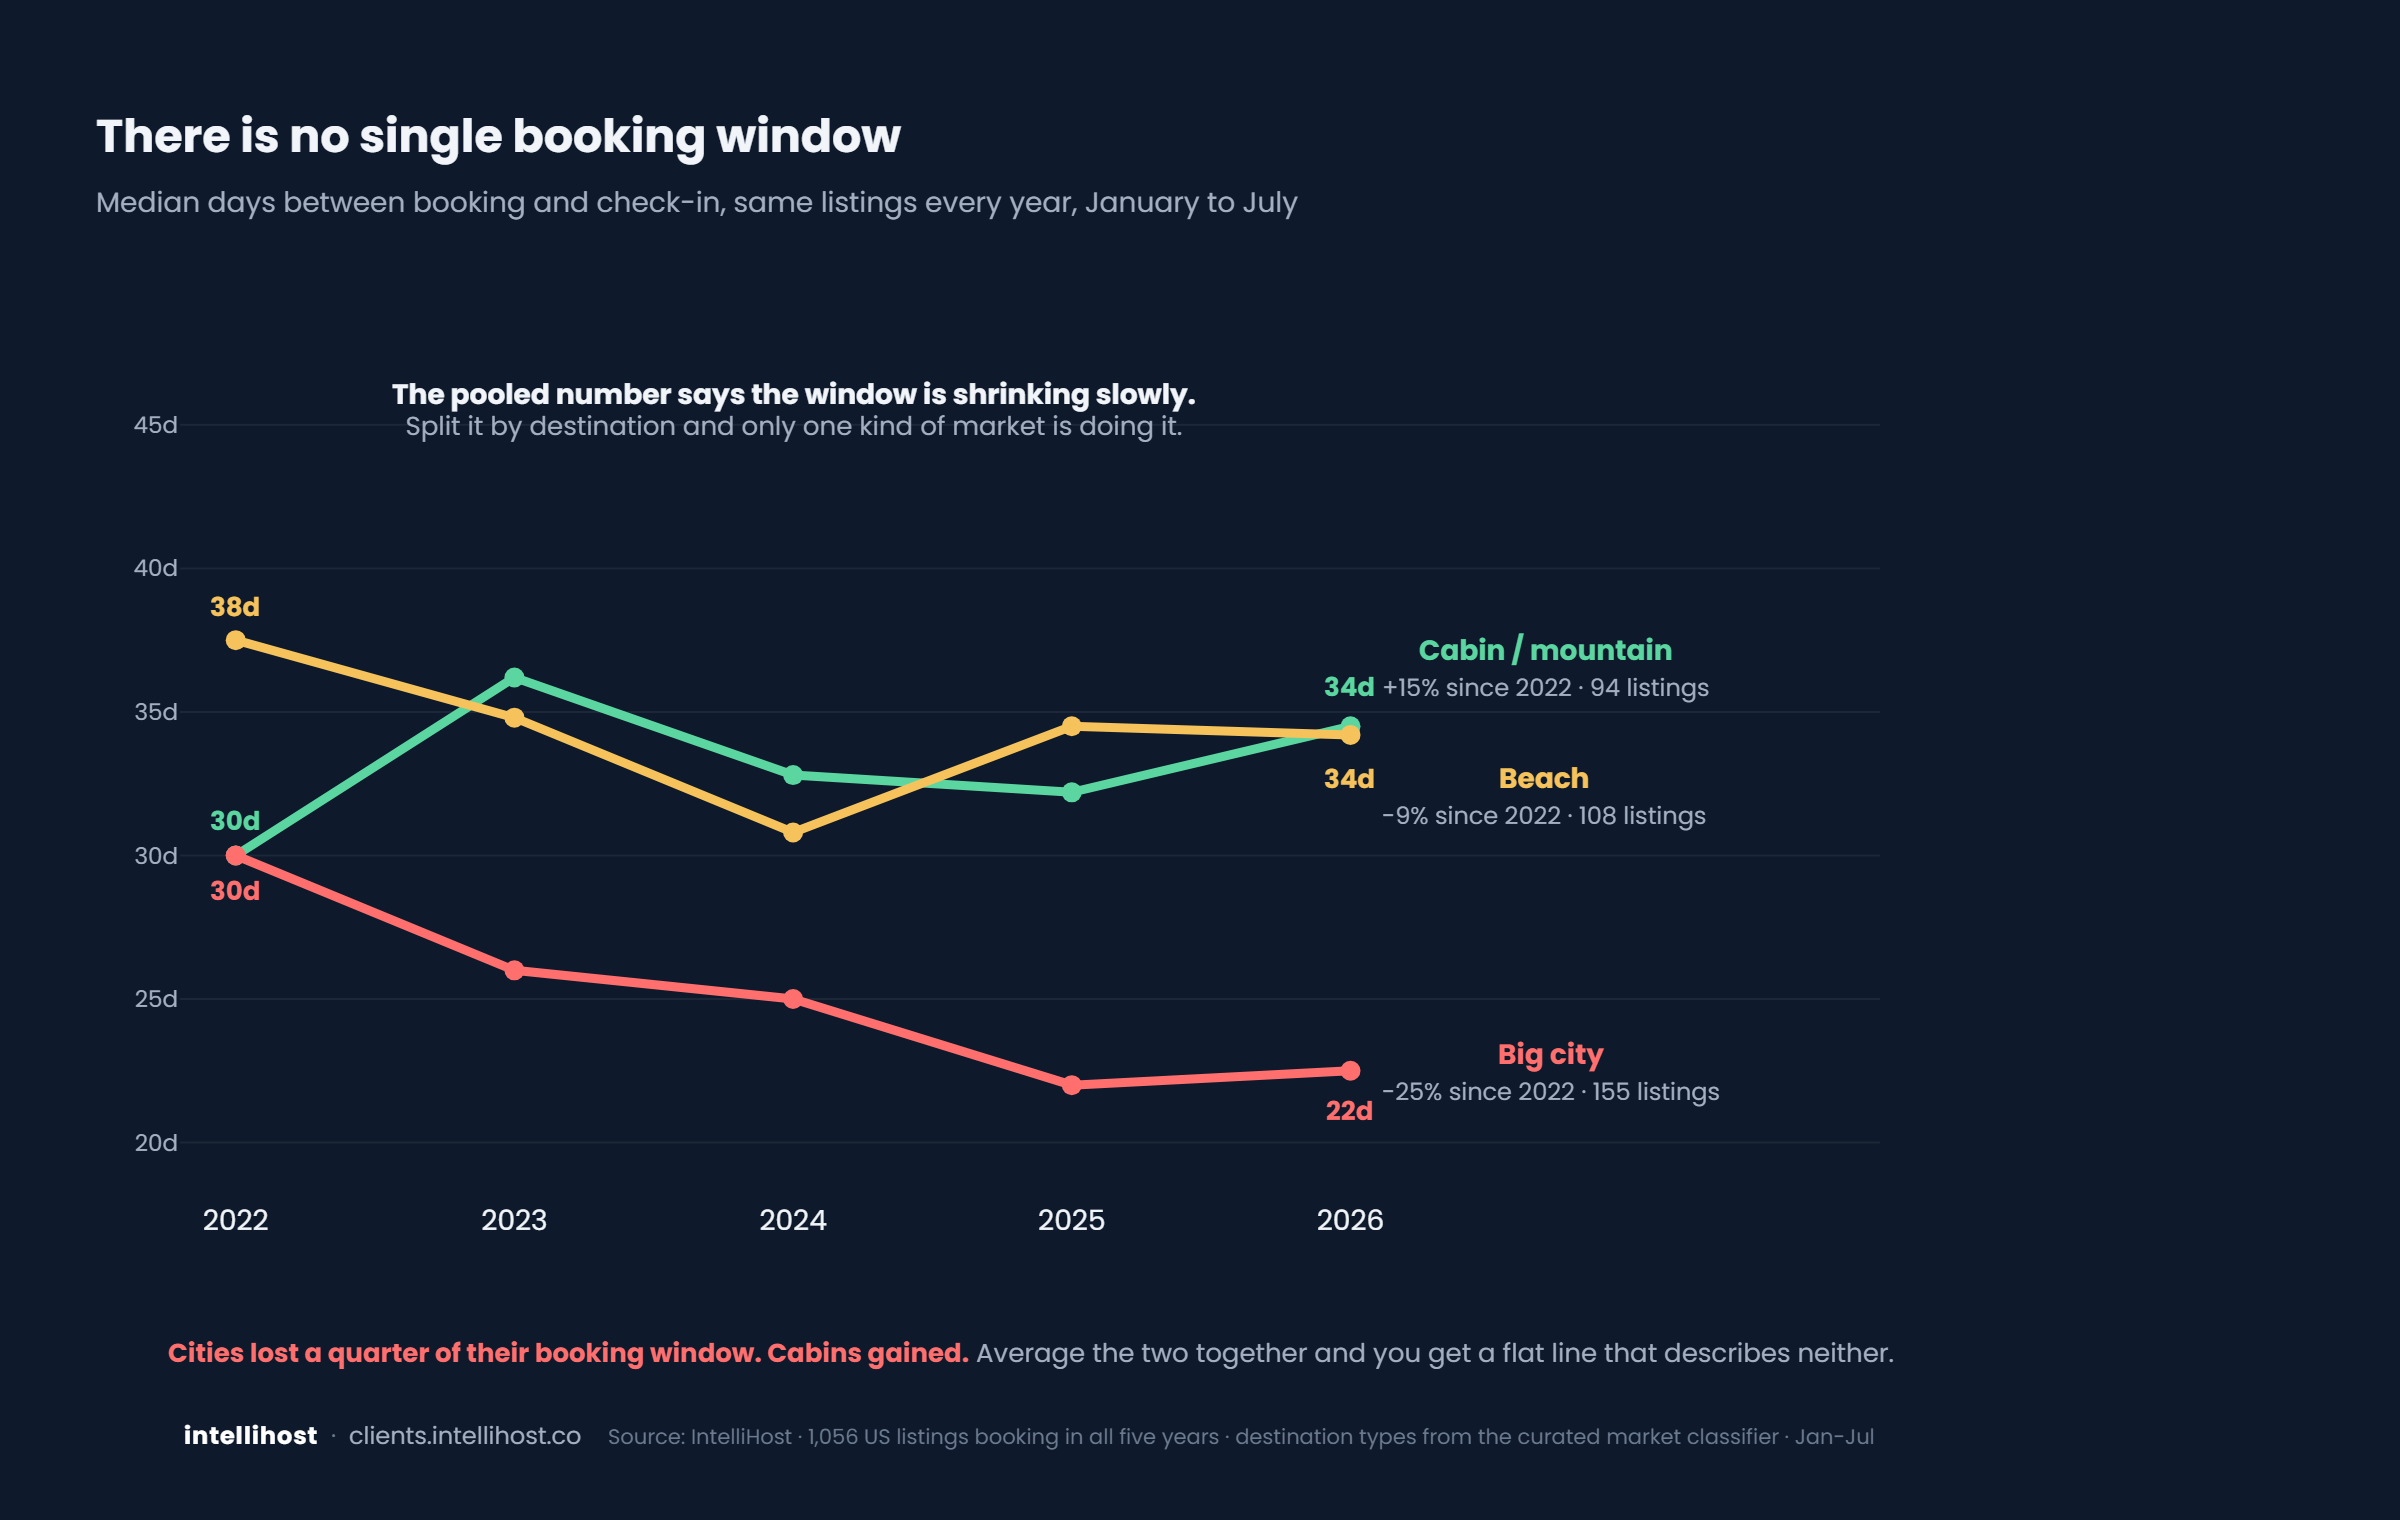
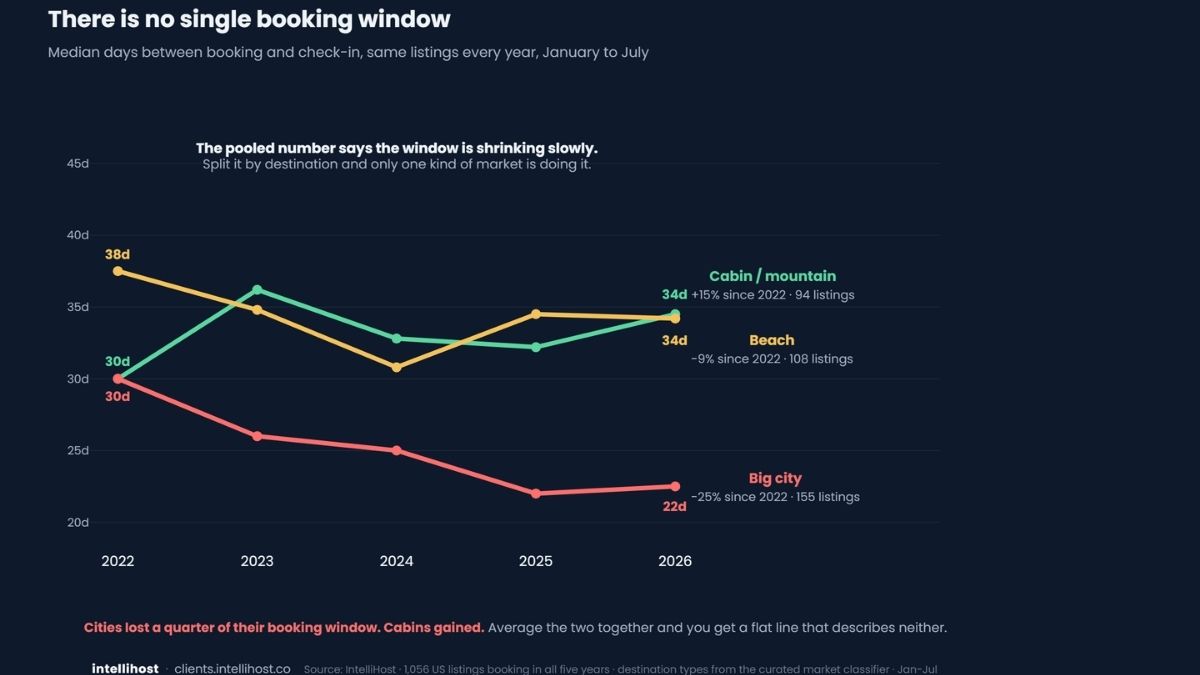
Big cities compressed hard. Median booking window went from 30 days in 2022 to 22 days in 2026. That is a 25% drop, and it fell in every single year. This is the compression the industry keeps describing, and in cities it is real and it is steep.
Cabins and mountain towns went the other way. 30 days in 2022, 34 days in 2026. Up 15%. Guests in those markets are planning further ahead than they were four years ago, not less.
Beach markets drifted down modestly. 38 days to 34 days, about 9%, with a dip and a partial recovery in between rather than a clean slide.
Average those together and you get a national line that barely moves. That flat line describes no actual market. It is a city collapse and a cabin expansion cancelling each other out.
Why a single national number misleads
Our own pooled figure makes the point. Across all US listings in our data, the median window moved from 37 days in 2019 to 25 today. On its own that looks like a clean story of collapse, and it is the same arithmetic problem in miniature.
Two things distort any pooled booking-window number.
The first is that averages and medians answer different questions. A small number of bookings made six months or a year ahead drags an average around while barely moving the median. Two analyses of the same market can disagree sharply for that reason alone.
The second matters more. Pooled figures change composition over time. If a dataset gains city listings faster than cabin listings, the measured window shortens even if not one guest changed their behaviour. The trend line moves because the mix moved.
That is the real lesson here, and it is not about booking windows specifically. A national average of something that varies this much by market is not a fact about anywhere.
What to do with this
If you operate in a city, the compression is not a rumour and it is probably steeper than the headlines told you. Your calendar genuinely fills later every year. That has two consequences. Your revenue forecasts need to stop treating an empty 30-day-out calendar as a problem, because that is now normal. And it makes last-minute pricing far more consequential than it used to be, because a larger share of your year is decided inside three weeks.
If you operate cabins or mountain properties, you have the opposite situation and the opposite risk. Guests are committing earlier than they did. The far end of your calendar is doing more work, not less. Discounting early to lock in bookings is the thing to be careful about, because the guest booking six months out is generally the least price-sensitive one you get. Giving them a discount trades margin for a booking you were likely to win anyway.
If you operate both, and plenty of managers do, then the single most useful thing here is that you should stop looking for one pricing posture. The two halves of your portfolio are moving in opposite directions.
What this does not prove
A few honest limits.
Ski, lake, desert and theme park markets all moved too, some substantially, but each has fewer than 60 listings in this cohort. I am not going to present those as findings.
This is correlational. We are describing what happened, not why. Remote work patterns, airline pricing, and the mix of trip purposes in cities are all plausible drivers and we have not isolated any of them.
And our data reflects professionally managed listings in the US. It is not a census of the whole platform.
What I am confident about is the shape. Cities and cabins are not experiencing the same market, and any number that treats them as one is going to mislead you about your own calendar.
IntelliHost gives short-term rental operators the search and booking data behind their listings, including how often they appear in search and where bookings are lost. You can see what it looks like for your own portfolio at intellihost.co.

.webp)
.jpg)