Most hosts set a price, glance at the calendar, and only adjust when a month looks empty. Meanwhile, Airbnb is quietly showing them the demand for every date inside their own dashboard, and almost nobody uses it to price. The signal is clicks.
Every listing runs a funnel: how often you appear in search, how often someone clicks in to look, and how often that turns into a booking. Airbnb reports all three, and it benchmarks each against similar listings nearby. Here is how to turn that into a pricing decision.
Step 1: Open your funnel
From your hosting dashboard, open the Menu and choose Insights.
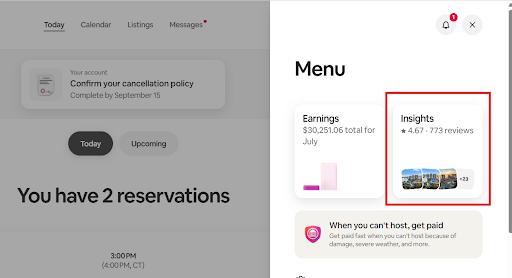
That opens the Performance area. In the left sidebar, go to Conversion, then Booking conversion. You will see your funnel in four numbers, each comparable to similar listings.
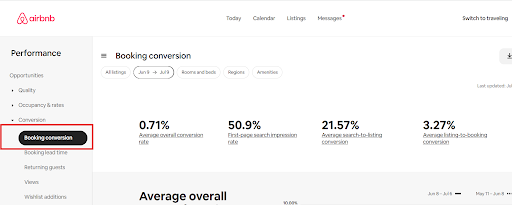
Here is what each one means:
- First-page search impression rate is how often you land on page one of search. This is visibility.
- Search-to-listing conversion is how often people who saw you actually clicked in. This is your click rate.
- Listing-to-booking conversion is how often a viewer went on to book.
Step 2: Find where you lose people
There are three leak points, and only two of them are a pricing problem.
If your first-page impression rate trails similar listings, that is a visibility problem, not a price problem. Search rank is driven by reviews, response rate, and how new the listing is. Cutting price will not fix it, and you will leave money on the table.
If your impression rate is healthy but your search-to-listing conversion trails, guests are seeing you and scrolling past. In search results they see two things: your cover photo and your nightly price. If your price sits above comparable listings and the photo does not justify it, you lose the click. A stronger cover photo or a small price move wins it back.
If your click rate is fine but your listing-to-booking conversion trails, guests look and leave. That gap is almost always price-to-value at the detail level: your total with fees, your minimum stay, or a calendar that fights the trip they wanted. Strong clicks and weak bookings mean your price is too high for what the listing delivers.
Step 3: See the demand for the dates you are actually pricing
This is the step most hosts miss. By default these screens show the past. To read demand for a night you have not sold yet, you have to change the date range to a future window.
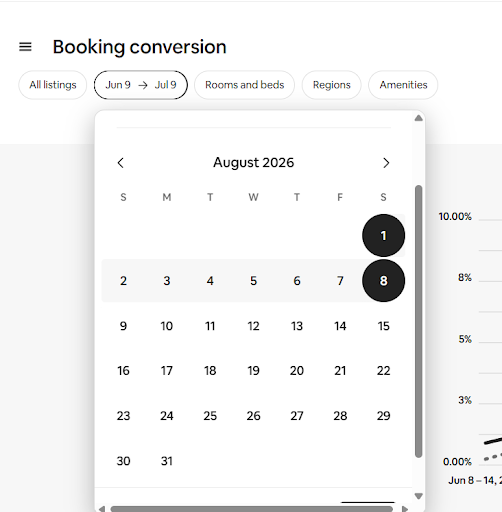
Now open Conversion, then Views, to see page views (clicks) for those upcoming dates, plotted against similar listings in your area.
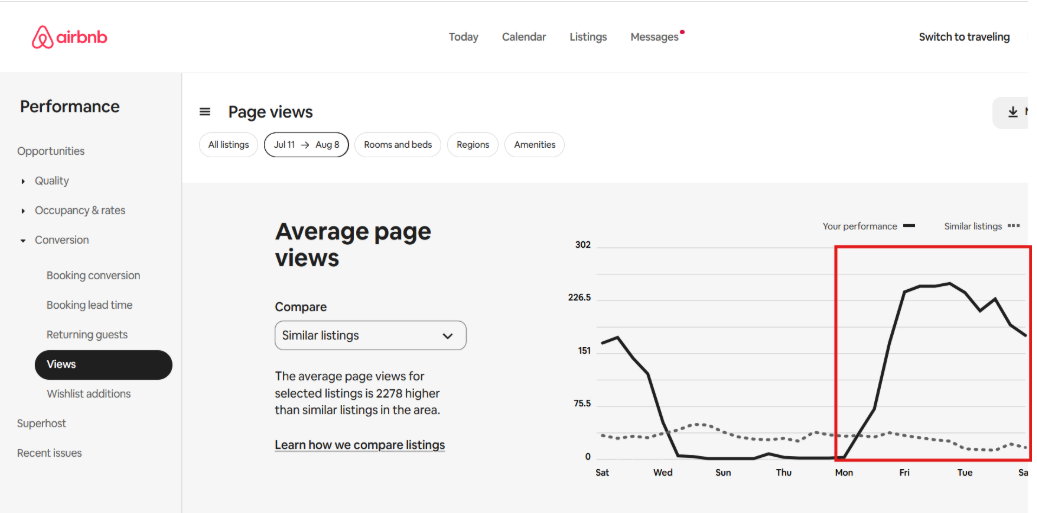
Read it like this. If click demand for an upcoming date is climbing and rising above similar listings while you are still open, you have room to hold or raise. If a date is close and clicks are flat or below your peers, cut while there is still time to book.
Timing is the whole game here. In our data across active listings, a given night collects close to half of its search interest in the final three weeks before check-in. So the window where your price matters most is the two to three weeks before arrival, and you can watch that demand arrive in this exact chart. Pricing a date once and forgetting it means setting your rate before the demand shows up.
The catch
Doing this well means checking the funnel on every listing and tracking the click trend on every future date, then adjusting before demand peaks rather than after. That is a lot of tabs. Software can watch all of it and move price into the demand curve automatically, which is the category IntelliHost works in, and there are others.
Either way, the point holds: stop pricing off a hunch when Airbnb is already showing you the demand for every night on your calendar.
Disclosure: I’m the founder of IntelliHost, which builds traffic-based pricing for short-term rental operators. If you’d like your listing’s click and conversion data turned into a nightly price automatically, you can see how it works at intellihost.co, or connect with me on LinkedIn.

.webp)